The next step is to understand what the sensor values represent in the real world. I always find it best to comprehend something when I can see it. Therefore, the next step is to visualize each of the data points (Ax, Ay, Az, Gx, Gy, Gz) received from the sensor in real-time. Python is not the ideal tool for real-time (RT) projects, but I hope it will be sufficient for something this simple.
pyGame seems like a good starting point for the graphical part. Unlike my usual approach to pyGame, here I decided that the trigger for rendering would be the arrival of a new data packet via the serial port. Perhaps unnecessarily, but to reduce the amount of bytes transmitted over the 115200 bps connection, the data packet is binary and looks like this:
| Byte Offset | Field | Size (bytes) | Format | Description |
|---|---|---|---|---|
| 0 | Sync | 1 | 0xAA | Synchronization byte |
| 1 | Ax | 2 | Big Endian | Acceleration X |
| 3 | Ay | 2 | Big Endian | Acceleration Y |
| 5 | Az | 2 | Big Endian | Acceleration Z |
| 7 | Tmp | 2 | Big Endian | Temperature |
| 9 | Gx | 2 | Big Endian | Gyroscope X |
| 11 | Gy | 2 | Big Endian | Gyroscope Y |
| 13 | Gz | 2 | Big Endian | Gyroscope Z |
| 15 | Δt | 2 | Big Endian | Time elapsed since last sample (microseconds) |
I have slightly complicated the parsing of serial communication due to issues with display “stuttering,” but it turned out that it would work even with a dynamic array. It seems that it does not work equally well on all operating systems. Here is the part of the code that receives and prepares the packet for processing:
self.capacity = 100
self.buffer = bytearray(self.capacity)
self.buf_len = 0
...
def _read_loop(self):
    while self._running:
        raw_data = self.ser.read(self.ser.in_waiting or 1)
        if raw_data:
            self._write_to_buffer(raw_data)
            self._process_buffer()

def _write_to_buffer(self, data: bytes):
    data_len = len(data)
    free_space = self.capacity - self.buf_len
    if data_len > free_space:
        if self.buf_len > 0:
            self.buffer[:self.buf_len] = self.buffer[self.capacity - self.buf_len:self.capacity]
        free_space = self.capacity - self.buf_len
        if data_len > free_space:
            data = data[:free_space]
            data_len = len(data)
    self.buffer[self.buf_len:self.buf_len+data_len] = data
    self.buf_len += data_len

def _process_buffer(self):
    packet_length = 1 + self.raw_data_length
    i = 0
    while i < self.buf_len:
        if self.buffer[i] == self.sync_byte[0]:
            if self.buf_len - i >= packet_length:
                packet_view = memoryview(self.buffer)[i+1:i+packet_length]
                if self.packet_callback:
                    self.packet_callback(packet_view)
                i += packet_length
                continue
            else:
                break
        else:
            i += 1
    if i > 0:
        remaining = self.buf_len - i
        self.buffer[:remaining] = self.buffer[i:self.buf_len]
        self.buf_len = remaining
...
When the packet is fully received, a callback is triggered that processes the data (nothing particularly interesting for now) and the main thread renders the display using pyGame. Processing of data from the packet:
...
self.ACCEL_SCALE = 16384.0  # For ±2g
self.GYRO_SCALE = 131.0     # For ±250°/s
...
# Parsing raw data
accel_x = self._bytes_to_int16_s(packet[0], packet[1])
accel_y = self._bytes_to_int16_s(packet[2], packet[3])
accel_z = self._bytes_to_int16_s(packet[4], packet[5])

temp = self._bytes_to_int16_s(packet[6], packet[7])

gyro_x = self._bytes_to_int16_s(packet[8], packet[9])
gyro_y = self._bytes_to_int16_s(packet[10], packet[11])
gyro_z = self._bytes_to_int16_s(packet[12], packet[13])

self.time_diff = self._bytes_to_uint16(packet[14],packet[15])

# Conversion to real-world values
self.accel_x_g = accel_x / self.ACCEL_SCALE
self.accel_y_g = accel_y / self.ACCEL_SCALE
self.accel_z_g = accel_z / self.ACCEL_SCALE

self.temp_c = (temp / 340.0) + 36.53

self.gyro_x_dps = gyro_x / self.GYRO_SCALE
self.gyro_y_dps = gyro_y / self.GYRO_SCALE
self.gyro_z_dps = gyro_z / self.GYRO_SCALE
...
The final result is an application that visualizes these 6 parameters in real-time.
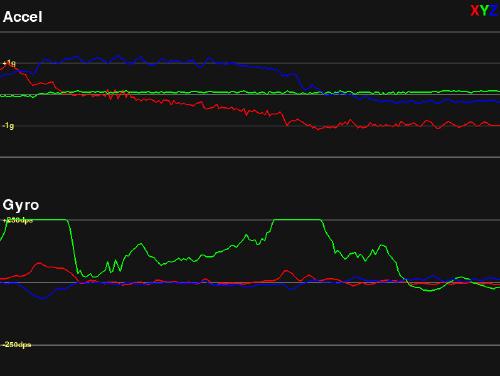
The source code for this solution -> here
The next step should be the calibration of the gyroscope and accelerometer, followed by testing some data fusion methods to obtain usable orientation values.